Best Raspberry Pi Hardware Monitor Software In 2024
Is your Raspberry Pi running at its optimal performance, or is it silently struggling under the weight of its workload? The ability to monitor your Raspberry Pi's hardware is not merely a technical luxury; it is a fundamental necessity for ensuring stability, maximizing lifespan, and troubleshooting performance issues that can arise unexpectedly. Without proper oversight, your small, powerful computer can quickly become a source of frustration, failing to deliver on its promises of efficiency and reliability.
The need for comprehensive monitoring is particularly acute in environments where Raspberry Pis are deployed in unattended applications, such as home automation systems, embedded devices, or data logging setups. In these scenarios, real-time insights into critical hardware metrics are invaluable. They allow for proactive identification of potential problems before they escalate into system failures, preventing costly downtime and ensuring uninterrupted service. Furthermore, monitoring provides a vital means of understanding how different software configurations and workloads impact the performance of your Raspberry Pi. This enables informed decision-making about system optimization, helping you to squeeze every last drop of power from your device.
The software landscape for monitoring Raspberry Pi hardware is surprisingly rich, offering a variety of solutions catering to diverse needs and skill levels. The options range from lightweight command-line utilities to sophisticated graphical interfaces, each providing different levels of granularity and analytical capabilities. The choice of the right tool depends entirely on the specific monitoring requirements, the technical expertise of the user, and the overall goals for the system.
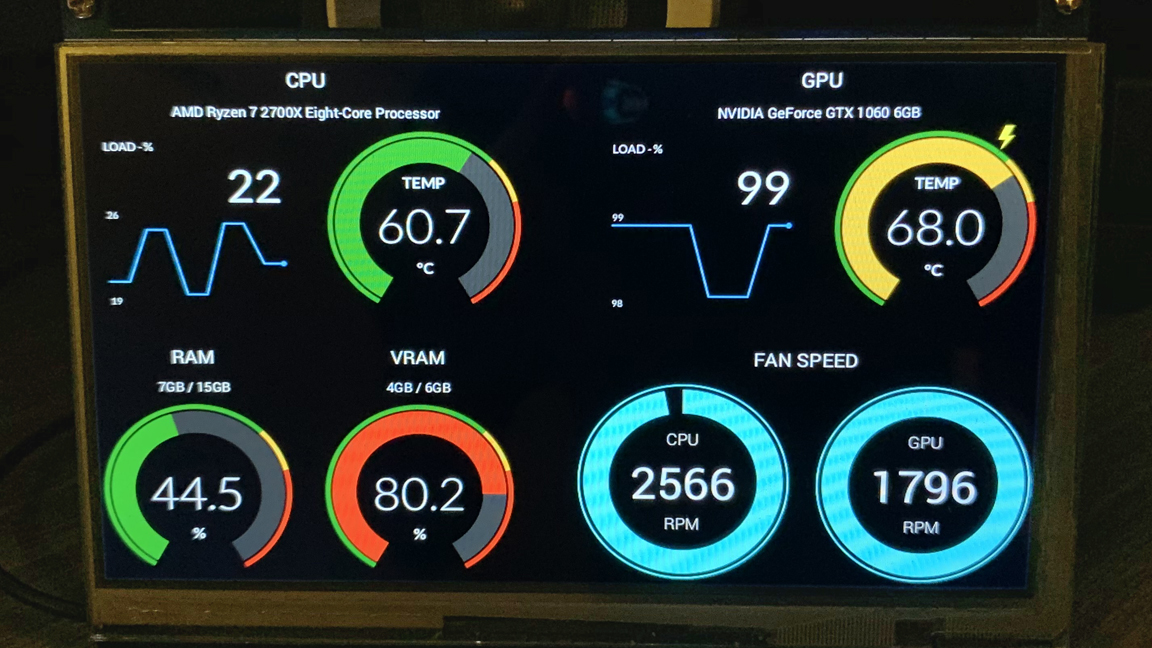
At the core of effective Raspberry Pi hardware monitoring lies the ability to track essential metrics. These include CPU temperature, CPU usage, memory utilization, disk space usage, network traffic, and voltage levels. Armed with this data, a user can readily identify bottlenecks, overheating issues, memory leaks, and other potential performance problems. The methods to monitor these metrics are varied and depend largely on the chosen software tools.
One of the most basic yet powerful tools for monitoring CPU temperature is the `vcgencmd` utility. This command-line tool is included by default in Raspberry Pi OS and provides a quick and easy way to check the current temperature of the CPU. Simply entering `vcgencmd measure_temp` in the terminal will return the temperature in degrees Celsius. This information is critical, because excessive heat can lead to throttling, where the CPU deliberately slows down to prevent damage. Monitoring temperature allows for identification of thermal issues and application of appropriate cooling solutions, such as heat sinks or fans.
CPU usage, another vital metric, offers insights into how actively the CPU cores are working. High CPU usage indicates that the system is under heavy load, potentially impacting performance. The `top` command, readily available in most Linux distributions, presents a dynamic view of running processes and their CPU usage. `top` shows which processes are consuming the most CPU resources, helping to pinpoint the source of performance bottlenecks. Another useful command is `htop`, a more user-friendly and interactive alternative to `top`, providing a color-coded display of CPU usage and process information.
Memory utilization is equally critical. Running out of memory can cause the system to become unresponsive or crash. Monitoring memory usage allows for detection of memory leaks or applications that are consuming excessive RAM. The `free` command provides an overview of the system's memory usage, including total memory, used memory, free memory, and buffers/cache. By regularly checking the output of the `free` command, users can identify memory issues and take corrective actions, such as restarting problematic applications or optimizing memory-intensive processes.
Disk space is often a neglected resource, yet it is essential for the smooth operation of the Raspberry Pi. Running out of disk space can cause file system errors, prevent new data from being written, and even render the system unusable. The `df` command provides a detailed view of disk space usage, showing the total disk space, used space, available space, and percentage of disk space used for each mounted file system. Regularly monitoring disk space allows for the detection of potential storage issues and prevents the system from unexpectedly running out of space.
Network traffic monitoring is critical for applications that rely on network connectivity. The `iftop` command provides a real-time display of network traffic on a per-connection basis, showing which devices are sending and receiving the most data. Another useful tool is `vnstat`, which provides a detailed history of network traffic, including daily, monthly, and total traffic volumes. Network traffic monitoring can assist in identifying network bottlenecks, detecting suspicious network activity, and optimizing network performance.
Voltage monitoring is essential for identifying potential power supply problems. Insufficient voltage can cause the Raspberry Pi to become unstable, leading to data corruption or system crashes. While not all monitoring software directly displays voltage levels, some applications can provide this information. If experiencing frequent system instability, a user should investigate the power supply and ensure it is providing sufficient voltage and current to the Raspberry Pi.
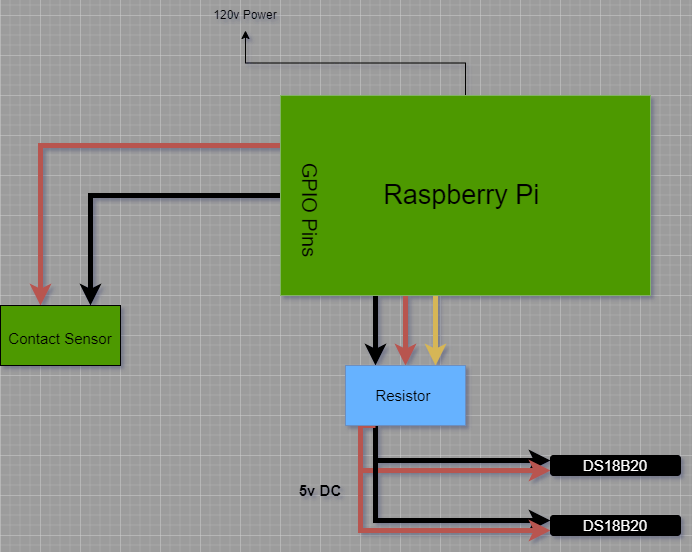
Beyond these core metrics, the landscape of Raspberry Pi monitoring extends to specialized applications and advanced techniques. For example, users may also need to monitor fan speeds, GPIO pin states, and other hardware-specific parameters, depending on the particular use case. Many monitoring tools are highly customizable and allow for setting up alerts to notify the user when specific thresholds are exceeded, ensuring that the user is promptly informed of any potential problems.
One popular approach to monitoring involves using command-line tools and scripting. This offers a high degree of flexibility and control, allowing users to tailor the monitoring process to their precise needs. A simple script can be created to periodically gather data from the various system utilities mentioned above and store it in a log file or send it to a remote monitoring server. This approach is especially useful for automating data collection and providing historical insights.
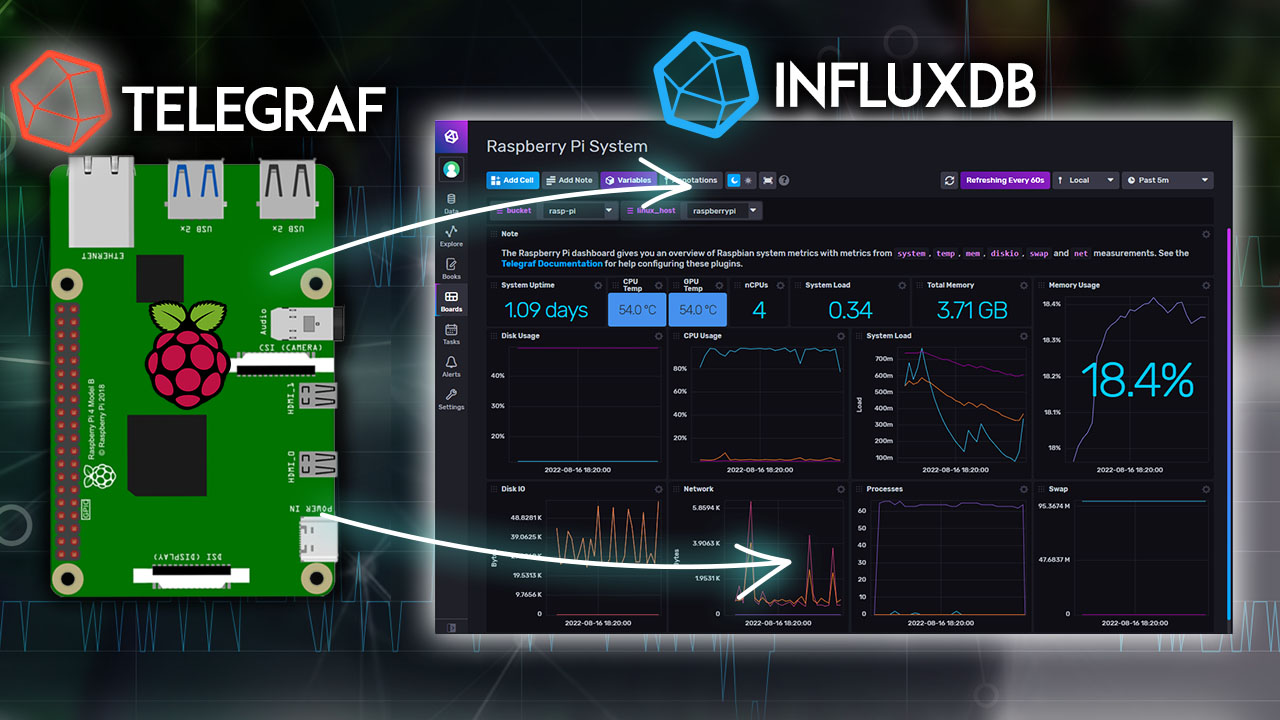
Another route is to embrace dedicated monitoring software. There is a plethora of applications designed specifically for Raspberry Pi monitoring, offering features such as real-time dashboards, historical data charting, and alert notifications. One of the most widely used is `Rpi-Monitor`. `Rpi-Monitor` provides a web-based interface for monitoring a wide range of hardware metrics, including CPU temperature, CPU usage, memory usage, disk space usage, and network traffic. It offers a user-friendly graphical interface, making it easy to visualize the data and identify potential problems.
For users who are comfortable with more advanced configuration, `Netdata` is a powerful tool that provides real-time performance monitoring and analysis. `Netdata` offers extensive dashboards that display a wealth of performance data, including CPU usage, memory usage, disk I/O, network traffic, and more. It also provides detailed graphs and charts, making it easy to identify performance bottlenecks and track down the root cause of problems. `Netdata` can be installed on a Raspberry Pi with relative ease and is highly configurable.
Another option that presents both a good starting point and advanced capabilities is the `Grafana` and `Prometheus` stack. `Prometheus` is a monitoring system that collects metrics from various sources, while `Grafana` is a powerful dashboarding tool used to visualize those metrics. While the initial setup can be more involved compared to simpler solutions, `Grafana` and `Prometheus` offer enormous flexibility and scalability, especially for complex monitoring needs. Users can define custom dashboards and alert rules to meet their precise requirements.
For the most technically inclined, there are possibilities to build custom monitoring solutions using programming languages like Python. Python, with its vast library ecosystem, offers a powerful foundation for data acquisition, processing, and visualization. Users can write custom scripts to gather data from system utilities, process the data, and create custom dashboards using libraries like `matplotlib` or `plotly`. This approach allows for maximum control over the monitoring process but demands a higher level of programming proficiency.
When choosing a Raspberry Pi hardware monitor software solution, several factors should be considered. First and foremost, the software should meet the specific monitoring requirements of the user. This includes the metrics that need to be tracked, the level of detail required, and the desired visualization options. Next, the software's ease of use should be taken into account. Some monitoring solutions are simpler to set up and use, while others require more advanced configuration. Finally, the performance overhead of the software should be assessed. The monitoring software itself should not consume excessive system resources, as this can impact the performance of the Raspberry Pi.
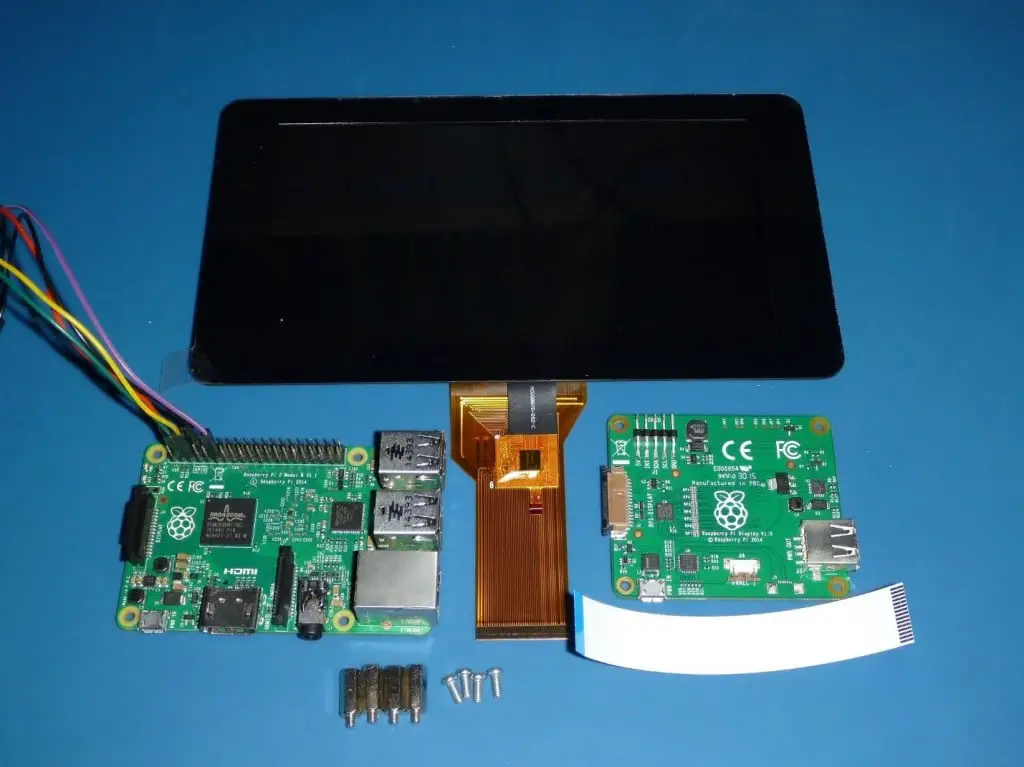
In addition to selecting the right software, users can also enhance their Raspberry Pi monitoring setup through hardware improvements. The most important consideration is the cooling solution. Overheating is a common problem in Raspberry Pis, and it can significantly impact performance. Adding a heat sink or a fan can help to keep the CPU temperature within safe limits, preventing throttling and extending the lifespan of the device. Additionally, ensuring a reliable power supply is of paramount importance. Using a high-quality power adapter that provides sufficient voltage and current is crucial to prevent power-related issues.
The ability to monitor your Raspberry Pi hardware is essential for optimizing performance, troubleshooting problems, and ensuring the reliability of your system. The choice of monitoring software depends on the specific needs of the user, but the availability of various options enables everyone from beginners to seasoned professionals to find a suitable solution. From basic command-line tools to sophisticated graphical interfaces and custom scripting solutions, there's something for everyone.
Regularly monitoring CPU temperature, CPU usage, memory utilization, disk space, network traffic, and voltage levels empowers you to identify and address potential problems before they escalate into major issues. This proactive approach protects your investment, minimizes downtime, and allows you to get the most out of your Raspberry Pi. By investing in the appropriate monitoring tools and practices, you can ensure your Raspberry Pi operates at its peak performance and delivers the functionality you require. The world of Raspberry Pi hardware monitoring is both vast and valuable, and mastering it will only strengthen your abilities in the fascinating world of small computing.
.png)
