Build A Raspberry Pi Monitoring Dashboard: Tips & Tricks
Isn't it fascinating how we can now keep tabs on practically anything, from the health of our home network to the temperature of our garden shed, all thanks to the power of a tiny computer? The Raspberry Pi, coupled with the right monitoring dashboard, has democratized data collection and visualization, placing sophisticated monitoring capabilities within reach of hobbyists, educators, and professionals alike. It's a testament to the ingenuity of open-source software and the ever-shrinking cost of technology.
The allure of a Raspberry Pi monitoring dashboard stems from its versatility and affordability. Unlike expensive, proprietary solutions, a Raspberry Pi setup can be tailored to a specific need, whether it's tracking the performance of a server, monitoring environmental conditions, or visualizing data from sensors. The key lies in choosing the right software and hardware components to create a comprehensive and informative dashboard. But where to begin in a world overflowing with options? That's where we delve in.
Let's dissect the components that make up a typical Raspberry Pi monitoring dashboard. At its heart lies the Raspberry Pi itself, a credit-card-sized computer that serves as the brains of the operation. Then come the sensors or data sources. These could be anything from temperature sensors and humidity sensors to network traffic monitors and system performance indicators. Finally, there's the software: the dashboard itself, which collects, processes, and displays the data in a user-friendly format. Selecting the right software is crucial.
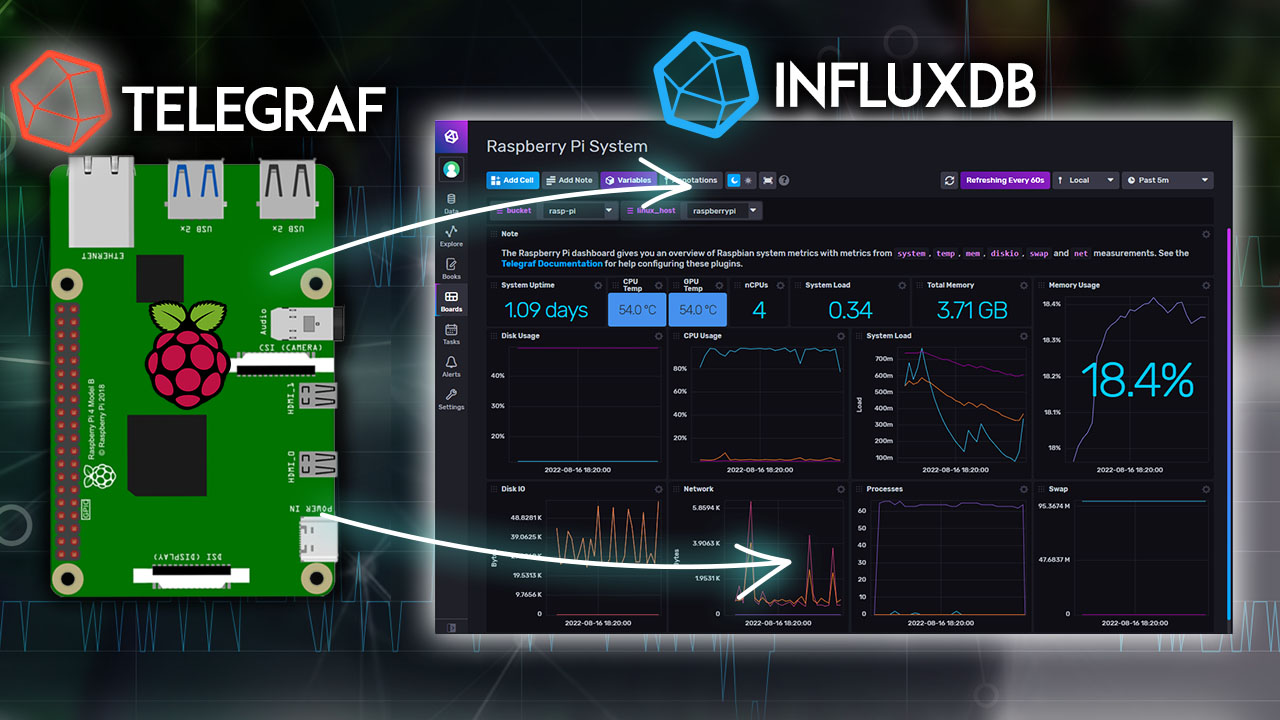
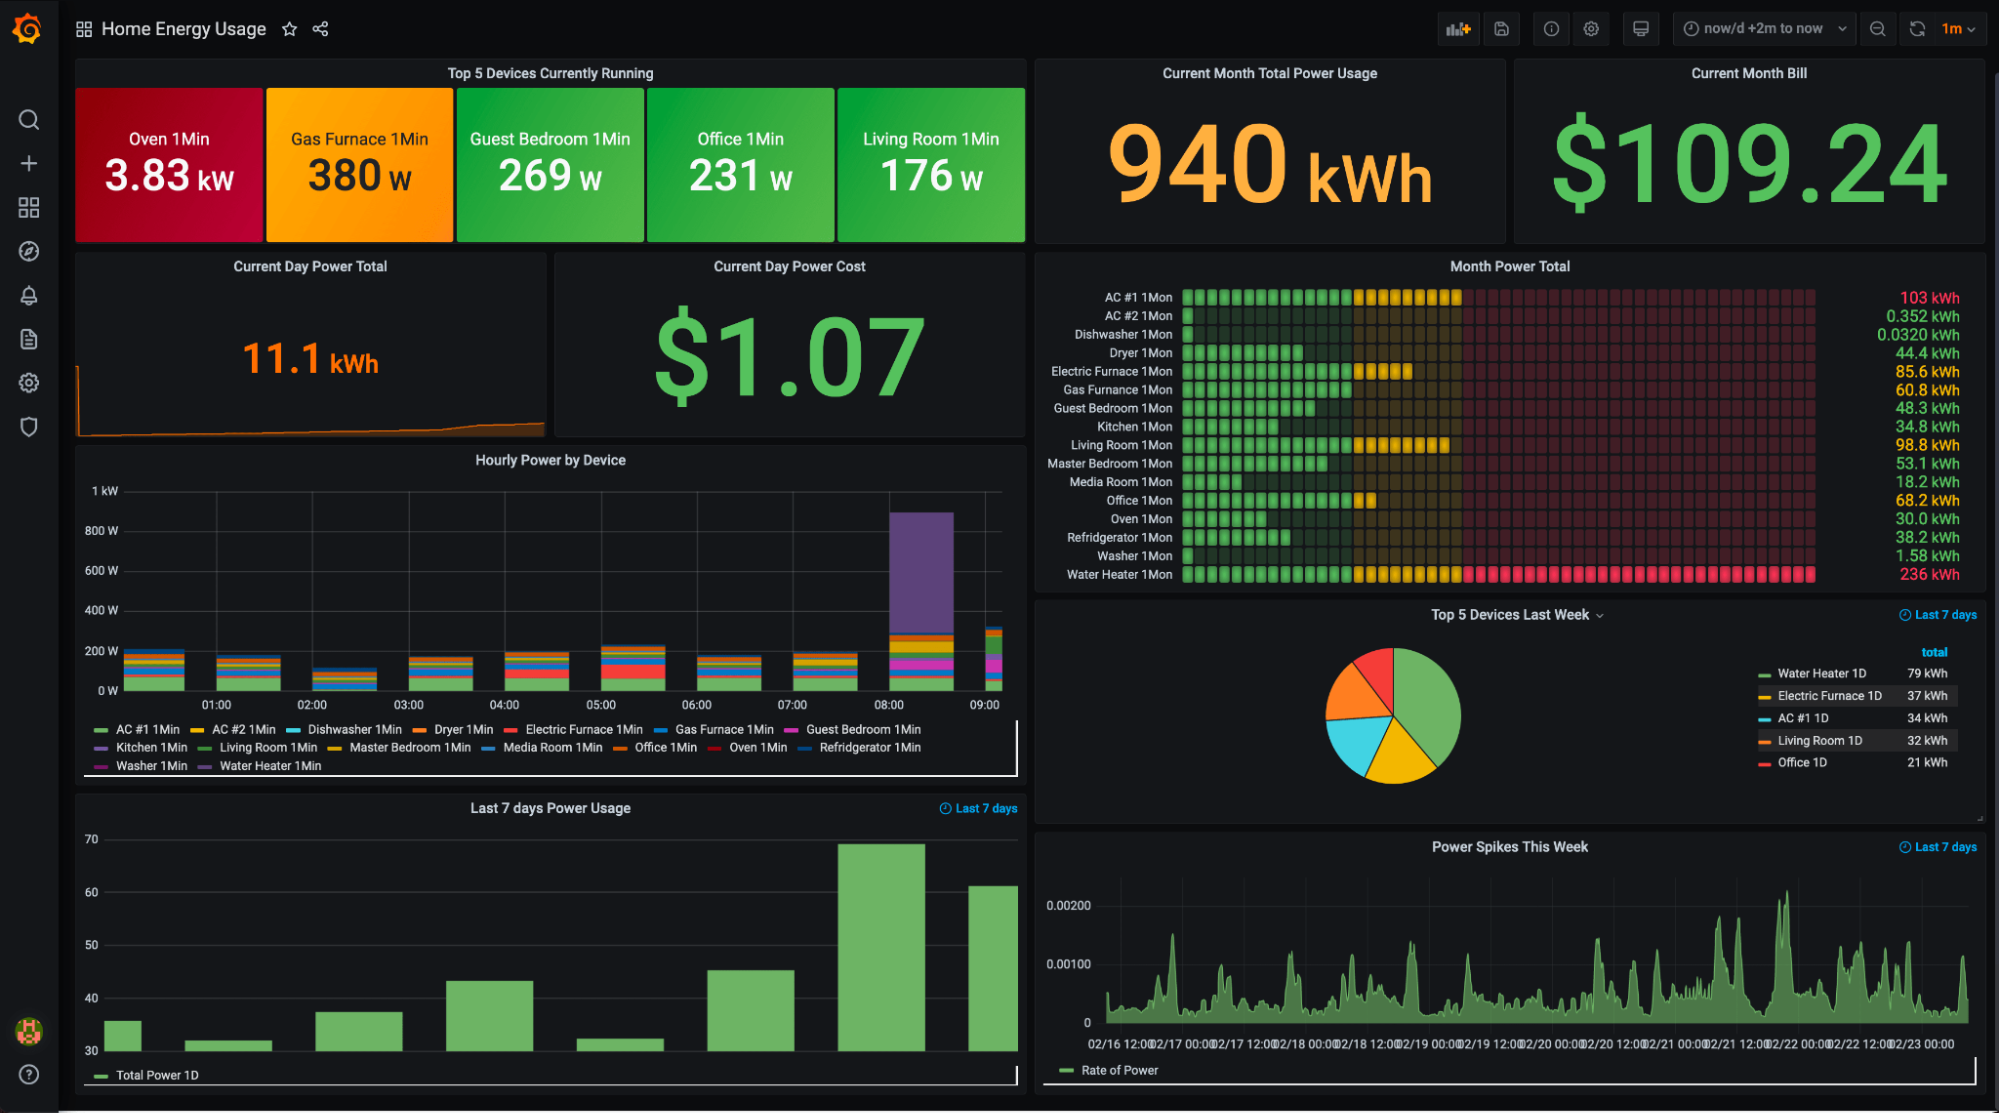
The choice of software is pivotal, as it dictates the functionality and user experience of the dashboard. Several excellent options are available, each with its strengths and weaknesses. Some popular choices include Grafana, a powerful and versatile dashboarding platform known for its extensive data visualization capabilities. Another is Home Assistant, particularly well-suited for home automation and environmental monitoring, offering a user-friendly interface and support for a wide range of devices. Other notable options include Node-RED, a flow-based programming tool that simplifies the creation of data pipelines, and Prometheus, a monitoring system specializing in time-series data. The choice often hinges on the specific monitoring needs and the user's technical proficiency.
Hardware plays a crucial role, providing the foundation upon which the monitoring system is built. The Raspberry Pi board itself is just the starting point. Depending on the application, additional hardware components may be required. These could include sensors, such as those for temperature, humidity, pressure, or air quality. Networking components, such as Ethernet cables or Wi-Fi adapters, are essential for connecting the Raspberry Pi to the network and enabling data transfer. For applications requiring more processing power, a Raspberry Pi with a faster processor and more memory may be advantageous. The selection of hardware should always align with the specific monitoring goals.
Consider the scenarios where these dashboards can prove invaluable. For instance, imagine monitoring the temperature and humidity of a greenhouse to optimize growing conditions. Or perhaps tracking the performance of a home server, identifying potential bottlenecks and ensuring smooth operation. The possibilities extend to the realm of smart homes, where dashboards can provide real-time insights into energy consumption, security systems, and overall home automation status. This ability to gain actionable insights into various aspects of our lives is transformative.
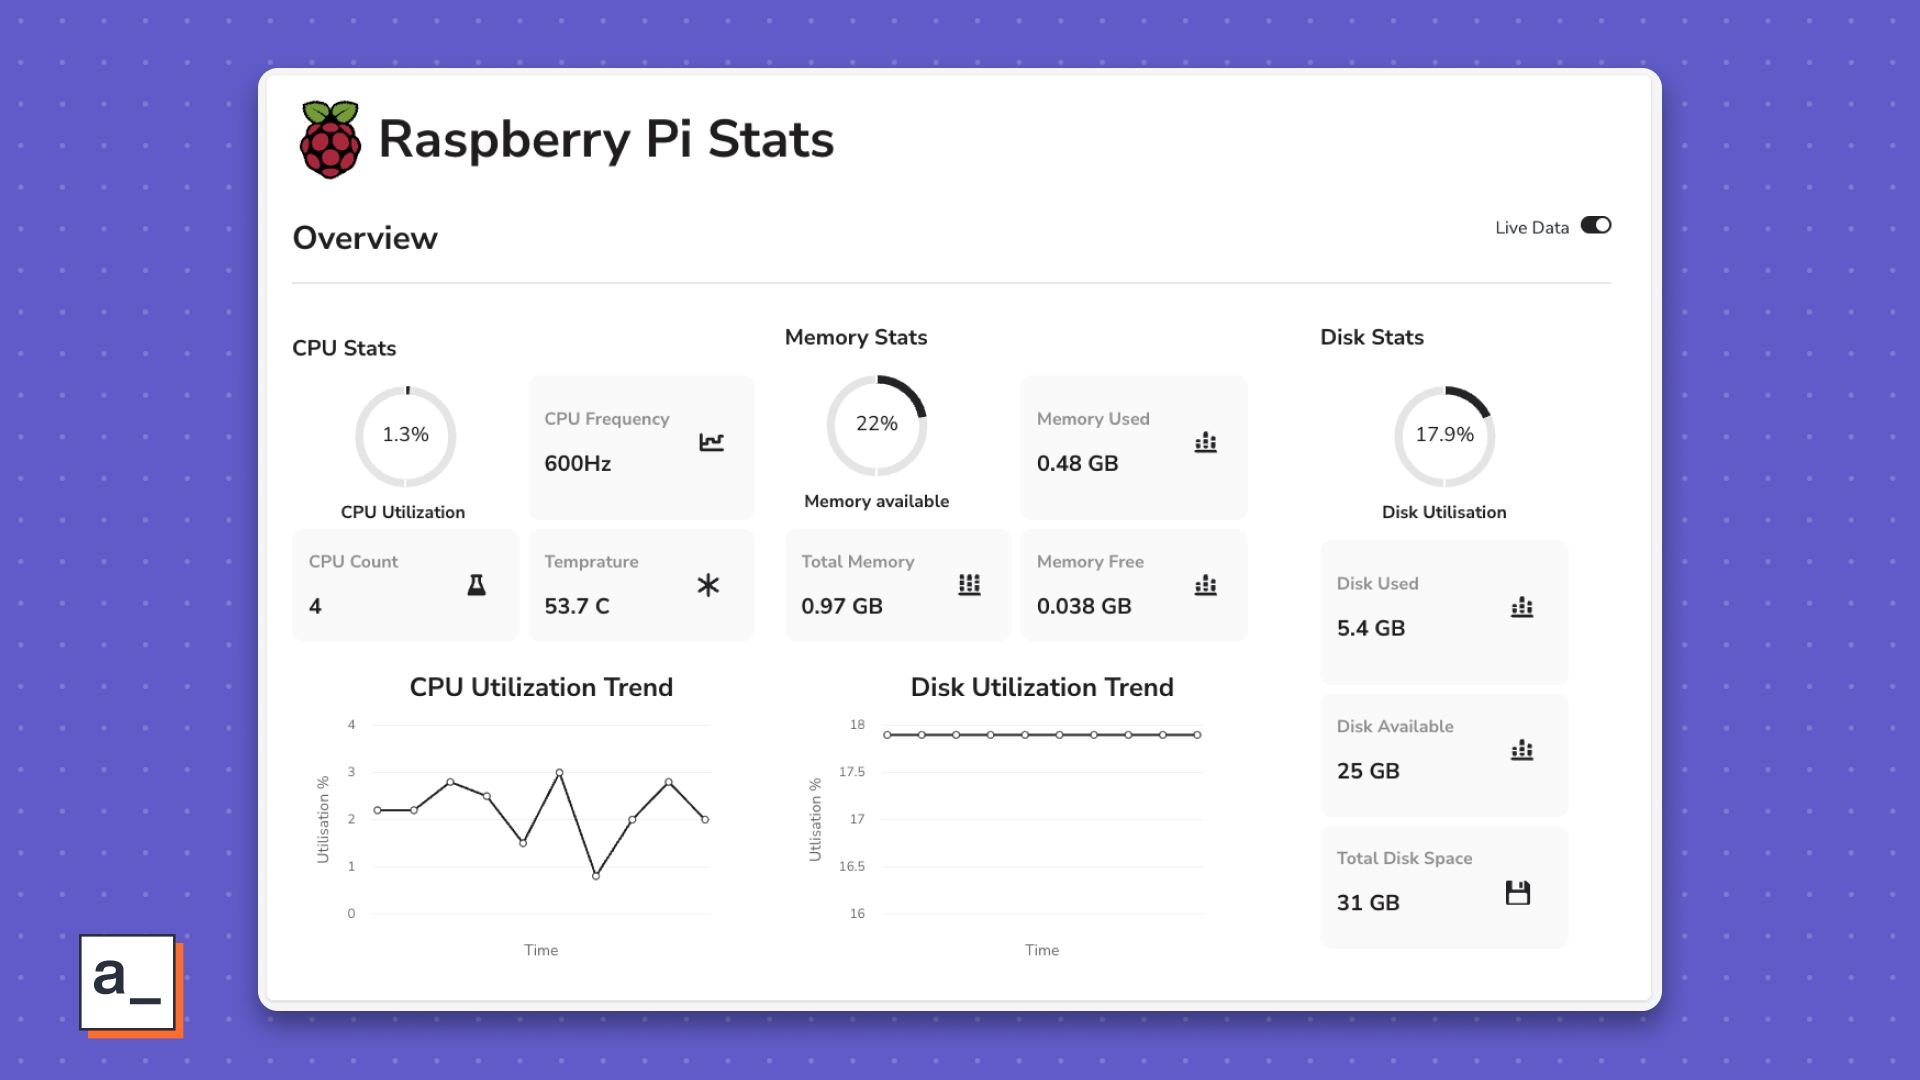
Implementing a Raspberry Pi monitoring dashboard typically involves several key steps. First, set up the Raspberry Pi by installing the operating system, typically Raspberry Pi OS (formerly Raspbian). Next, install the necessary software packages, such as the chosen dashboarding platform and any required drivers for sensors or data sources. Then comes the configuration: defining the data sources, setting up data collection intervals, and customizing the dashboard's appearance and functionality. Finally, test the system thoroughly to ensure accurate data collection and display. Regular maintenance, including software updates and hardware checks, ensures continued optimal performance. This process, while seemingly complex, is surprisingly accessible even for those with limited technical expertise.
Lets delve into how to establish one of these fascinating dashboards. A crucial first step is the selection of the correct hardware components and a Raspberry Pi model that meets your performance requirements. This includes considering the number of sensors or data sources that will be incorporated and the level of processing power needed. Next, choose the right dashboarding software based on its ease of use, the visualization features offered, and its ability to integrate with the hardware.
Heres a simplified guide to the setup process: Begin by downloading and installing the Raspberry Pi OS on a microSD card. Then, connect the Raspberry Pi to your network, either via Ethernet or Wi-Fi. Proceed to install the dashboard software and any drivers needed for your sensors. Configure the data sources and design the dashboard to display the information most relevant to your monitoring goals. Finally, test the system and fine-tune the configuration as necessary. The end result? A personalized, real-time view of the data that matters most to you.
To illustrate the practical application, let's consider a hypothetical scenario: monitoring the temperature and humidity of a grow tent. This setup would involve a Raspberry Pi, a temperature and humidity sensor, and dashboard software like Grafana or Home Assistant. The Raspberry Pi would collect data from the sensor at regular intervals, such as every minute. This data would then be stored and displayed on the dashboard, allowing the user to visualize trends and identify any fluctuations in the environment. The user could receive alerts if the temperature or humidity exceeded predefined thresholds. The value here lies in the ability to control and react to real-time data.
When selecting a dashboarding platform, consider the user interface (UI) and ease of use. Look for platforms that offer intuitive interfaces and customization options. The compatibility with different data sources is essential. Confirm that the platform can collect data from the sensors or data sources you're planning to use. Pay attention to the available visualization options, such as charts, graphs, and gauges. Choose a platform that provides the visualizations best suited for your data. Furthermore, consider the community support and documentation available. A large and active community often means extensive resources and assistance. The most suitable platform is one that best suits your specific requirements.
Securing a Raspberry Pi monitoring dashboard is paramount, as it often collects sensitive data and is connected to the network. Implement strong passwords and change them regularly. Keep the Raspberry Pi OS and all software up to date to patch security vulnerabilities. Configure a firewall to restrict network access to authorized devices. Use encrypted connections, such as HTTPS, when accessing the dashboard remotely. Consider using a VPN for an extra layer of security. These precautions help prevent unauthorized access and data breaches.
For example, in a home environment, ensure the network is secure by using a strong Wi-Fi password and enabling WPA3 encryption. The Raspberry Pi should be behind a firewall to block any external access to the dashboard without your explicit consent. Always update the operating system and software regularly to patch security vulnerabilities. These steps protect your data from potential breaches.
The future of Raspberry Pi monitoring dashboards is likely to be characterized by even greater ease of use, improved integration with other smart home devices, and advanced analytics capabilities. We can anticipate the development of more user-friendly dashboards with drag-and-drop interfaces and pre-built templates, making it easier for non-technical users to set up and configure their monitoring systems. Further integration with smart home ecosystems will enable seamless data sharing and control between dashboards and other devices, offering greater automation and convenience. The incorporation of machine learning and artificial intelligence (AI) will enhance the dashboards' ability to analyze data, predict trends, and provide intelligent alerts and recommendations. The evolution promises a future of smarter, more intuitive, and more proactive monitoring solutions.
In conclusion, the Raspberry Pi monitoring dashboard is more than just a collection of data; it is a tool for gaining insights, making informed decisions, and taking proactive action. Its versatility, affordability, and ease of use make it an invaluable asset for anyone looking to monitor and control their environment, whether at home, in the workplace, or in a research setting. The ability to customize and adapt these dashboards makes them an indispensable tool for modern living. The Raspberry Pi monitoring dashboard represents a gateway to a more informed and connected world.

